I am a researcher and data analyst at OBCT/CCI. Here is some information about my (not necessarily contiguous) professional interests.
For a long time, I have been conducting research on post-Soviet affairs, focusing in particular on de facto states. I have been visiting Russia and other post-Soviet countries since 2000, and I speak fluently Russian and Romanian.
In recent years, I have increasingly been working on structured approaches for analysing online sources in conflict studies and international relations, data collections methods, and related ethical issues.
I have also been working as a data analyst and consultant, crunching data at the European Data Journalism Network ( EDJNet), writing code and developing packages in the R programming language, and working on data visualisation and geographic data analysis.
I occasionally post on my data visualisation blog:
the codebase
.
PhD, Law and Government, 2018
Dublin City University
MA, area studies, 2006
MIREES - Interdisciplinary Research and Studies on Eastern Europe
BA, political science, 2004
University of Bologna
This post presents a data exploration tool developed by EDJNet. If you have a spreadsheet with longitude and latitude columns and would like to have a look at those data on a map or associate them with administrative units across Europe, you may well find this tool useful. You can try this online, or check out this screencast for an overview of its main features. The interface is available also through the R package latlon2map.
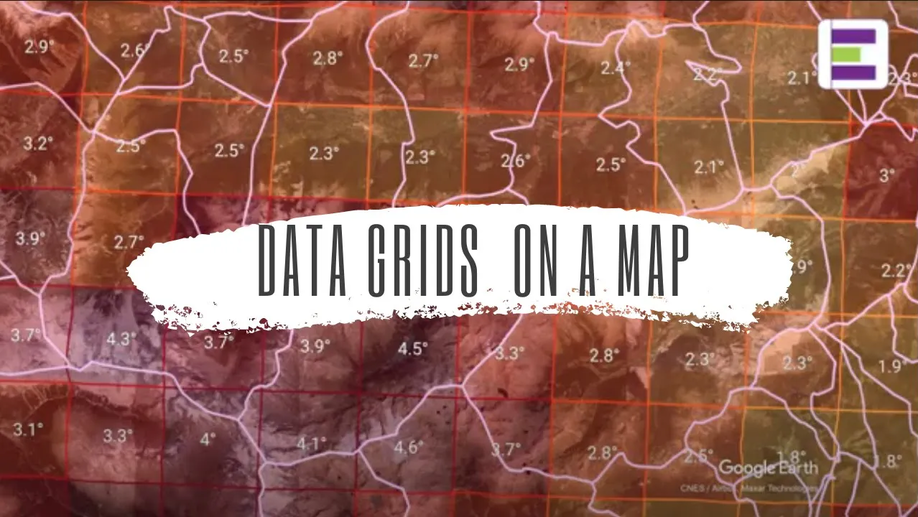
In this video, I point at some of the issues that characterise data grids and that may generate misunderstandings. In the video, I mention how gridded data can be generated via satellite imagery and machine learning techniques. Of course, such data can be generated also via other means. References This video is based on the data used for this article: Climate warming in Europe, municipality by municipality Municipality-level data for Italy can be accessed through this interactive interface: In marcia con il clima
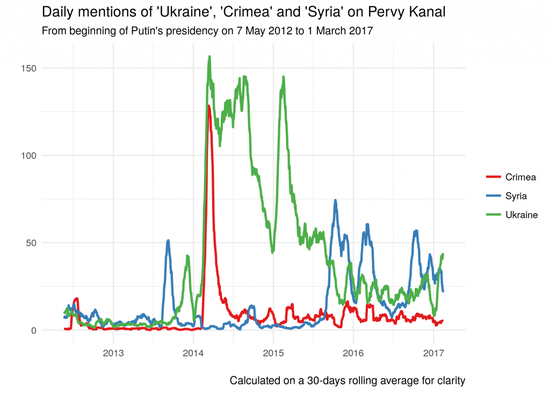
castarter is designed to make it easy also for relatively inexperienced users to create a textual dataset from a website, or a section of a website, keep it up-to-date, and explore it through word frequency graphs or a web interface that makes it possibe to tag items. Documentation is available on castarter’s website.
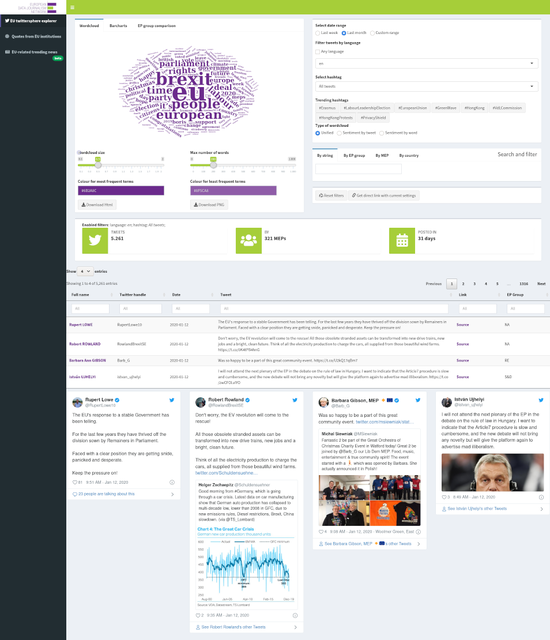
EDJNet’s Quote Finder facilitates finding different takes on European affairs. It provides an interactive interface to explore and filter tweets by all members of the European Parliament who are on Twitter, and to visualise word frequencies as wordclouds. It is possible to filter contents based on keywords, hashtags, political affiliation and language of the tweet. A different interface allows for interactively exploring textual contents published by EU-institutions such as press-releases. In this case, available visualisations include time series in order to highlight changes in the relative prominence of certain issues within the official EU discourse.
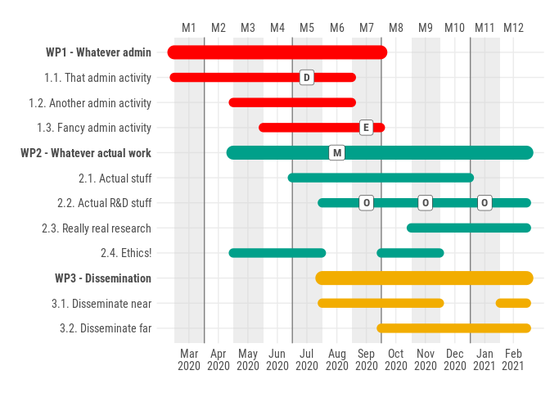
ganttrify facilitates the creation of nice-looking Gantt charts, commonly used in project proposals and project management. Documentation is available on GitHub.
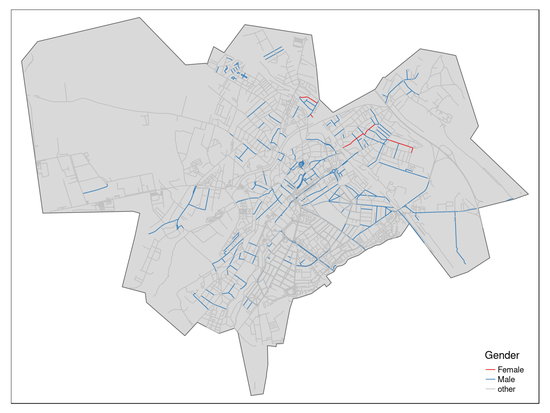
genderedstreetnames automatically finds the gender of street names, facilitates manually fixing what the automatic part got wrong, and plots the results. It gets information from OpenStreetMap and Wikidata. There is currently a vignette showing examples of what can be done with this package on the package’s website. Documentation is available on GitHub.
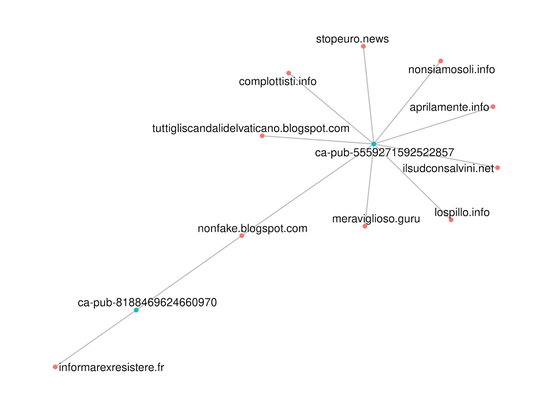
networkedwebsitesdetector offers a structured approach for finding websites which have clear signs of common ownership or are otherwise related. There is currently a vignette showing examples of what can be done with this package on the package’s website. Documentation is available on GitHub.
zoteror introduces basic functionalities to access the Zotero API. It allows to create new Zotero items, and to take a csv file (or data frame) and import it into Zotero, as long as data are properly mapped. zoteror has function that facilitate giving to tabular data a structure that can properly be read into Zotero. It facilitates resizing the storage space used, by ordering items by attachment size, and by allowing to add items to a collection if certain criteria are met.
In recent years, the legitimacy of electoral processes in Western democracies has been repeatedly put into question due to alleged …
Residents of post-Soviet de facto states have access to public goods and services to a large extent thanks to financial resources …
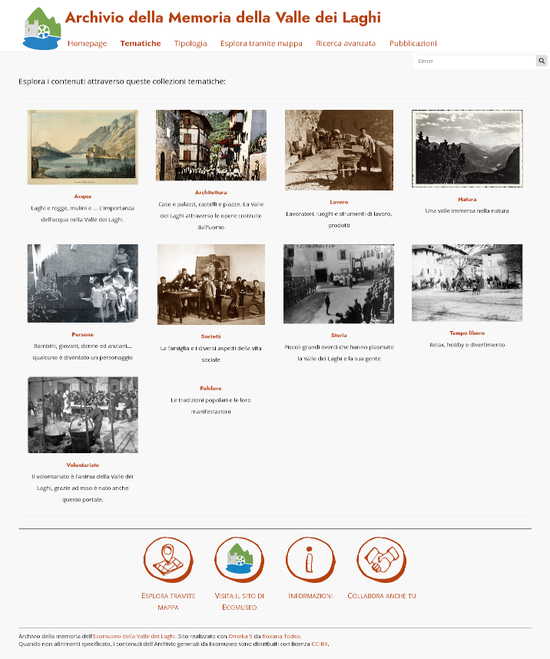
Digitising local history
R packages for research and data journalism
“Exploring systemic vulnerabilities for external influence in Italy”
Non-recognition is the symptom, not the cause
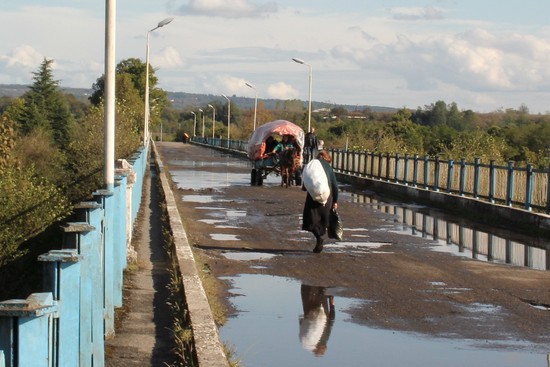
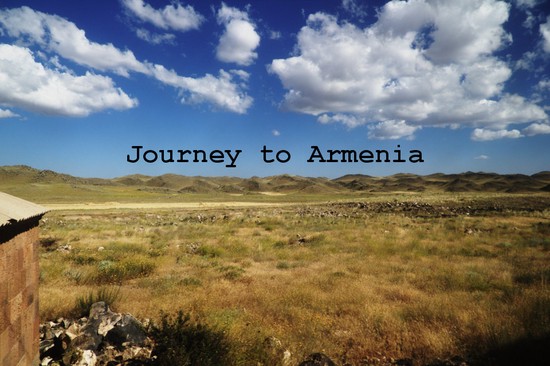
“Journey to Armenia” is a film documentary project I’ve been working on together with Andrea Rossini and other colleagues at OBCT between 2009 and 2013. It develops around the journey of Osip and Nadezhda Mandelstam in the Caucasus in 1930 (at the basis of Osip’s “Journey to Armenia”) and more in general around the life of the Mandelstams. At the same time, it is also a journey from Abkhazia to Nagorno Karabakh across today’s Caucasus.
Youth in the Northern Caucasus: associationism, identity, and patriotism in a complex, multi-ethnic context.