Google Earth Studio as a data visualisation tool (with R)
Google Earth Studio is a fancy tool that allows for the creation of videos of stunning quality, by making it possible to create smooth transitions between locations across the globe, zooming in closer to the ground, and showing mountains and cities in 3D.
Here is their own promo video:
However, so far I have not really seen it used for data visualisation, nor I have seen any post online discussing how to use Google Earth Studio with data.
Beautiful Gantt charts with ggplot2
A new straightforward online interface that makes it easy to create and customise decent-looking charts for grant applications
How to find the population-weighted centre of local administrative units
A structured approach and a new R package to deal with a recurrent question
castarter - content analysis starter toolkit for R
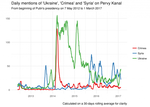
castarter is designed to make it easy also for relatively inexperienced users to create a textual dataset from a website, or a section of a website, keep it up-to-date, and explore it through word frequency graphs or a web interface that makes it possibe to tag items.
Documentation is available on castarter’s website.
EDJNet's Quote Finder
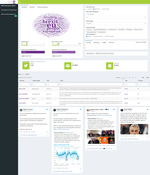
EDJNet’s Quote Finder facilitates finding different takes on European affairs. It provides an interactive interface to explore and filter tweets by all members of the European Parliament who are on Twitter, and to visualise word frequencies as wordclouds. It is possible to filter contents based on keywords, hashtags, political affiliation and language of the tweet. A different interface allows for interactively exploring textual contents published by EU-institutions such as press-releases. In this case, available visualisations include time series in order to highlight changes in the relative prominence of certain issues within the official EU discourse.
ganttrify - Create beautiful gantt charts with ggplot2
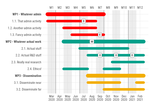
ganttrify facilitates the creation of nice-looking Gantt charts, commonly used in project proposals and project management.
Documentation is available on GitHub.
genderedstreetnames - Find and plot on a map gendered street names
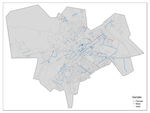
genderedstreetnames automatically finds the gender of street names, facilitates manually fixing what the automatic part got wrong, and plots the results. It gets information from OpenStreetMap and Wikidata.
There is currently a vignette showing examples of what can be done with this package on the package’s website.
Documentation is available on GitHub.
networkedwebsitesdetector
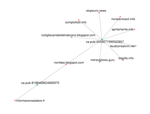
networkedwebsitesdetector offers a structured approach for finding websites which have clear signs of common ownership or are otherwise related.
There is currently a vignette showing examples of what can be done with this package on the package’s website.
Documentation is available on GitHub.
zoteror - Access the Zotero API in R
zoteror introduces basic functionalities to access the Zotero API. It allows to create new Zotero items, and to take a csv file (or data frame) and import it into Zotero, as long as data are properly mapped. zoteror has function that facilitate giving to tabular data a structure that can properly be read into Zotero. It facilitates resizing the storage space used, by ordering items by attachment size, and by allowing to add items to a collection if certain criteria are met.


